You can customize the summary dashboard by going to Overview > Dashboard Management > click on Create Dashboard. We set the refresh the dashboard display every 1 minute and click Create. You rename a tab by double-click and type its new name.
You can add and drag/drop the widget on the dashboard. To add a widget, you click on Add Widgets button. The example below I've dragged the Top Web Applications Seen.
By default there's no manually created reports under Overview > Reporting > Reports. There are pre-configured report templates under Report Templates tab. To create a report, you click on Create Report Template.
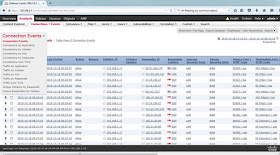
You can view more user/traffic graphs under Analysis > Context Explorer. You can also view connection events that are logged by FireSight under Analysis > Connections Events. You click on switch workflow to do a granular search.


