Friday, December 1, 2023

Configure Fortigate Link Aggregation

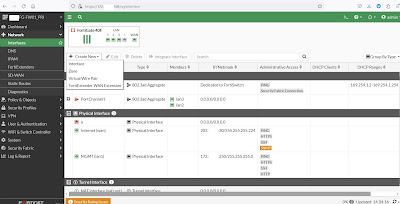
Here's a link to configure a link aggregation (LACP) interface in a FortiGate firewall. To configure, go to Global VDOM (if using Multi VDOM) > Network > Interfaces > Create New > Interface.

Type a Name > select Type: 802.3ad Aggregate.

Under Interface members > click add (+ icon) > select interfaces: lan2 and lan3.

To create an 802.1Q Layer 3 sub-interface via the aggregated link, go to Network > Interfaces > Create New > Interface.

Type a Name > select Type: VLAN > select VLAN protocol: 802.1Q (default) > select the created aggregated interface: PortChannel1 > type VLAN ID: 300 > select Role: LAN (optional).

Under Addressing mode > select: Manual > Type IP/Netmask: 172.27.100.1/255.255.255.248 (can also type: /29) > under Administrative Access > select: HTTP (for lab VM), HTTPS, SSH and PING > click OK.

I've configured an EtherChannel interface in the adjacent Cisco switch using ports FE0/1 and FE0/2 and also connected a PC using the inside VLAN 300.


SW01#configure terminal

Enter configuration commands, one per line.  End with CNTL/Z.

SW01(config)#vlan 300

SW01(config-vlan)# name LAB-INSIDE

SW01(config-vlan)#exit

SW01(config)#interface range Fa0/1-2

SW01(config-if-range)# description ### PortChannel1 ###      

SW01(config-if-range)# switchport trunk encapsulation dot1q

SW01(config-if-range)# switchport mode trunk

SW01(config-if-range)# channel-group 1 mode active

Creating a port-channel interface Port-channel 1


SW01(config-if-range)# no shutdown

SW01(config-if-range)#

*Mar 17 01:08:11.597: %LINEPROTO-5-UPDOWN: Line protocol on Interface Vlan1, changed state to down

*Mar 17 01:08:12.570: %LINEPROTO-5-UPDOWN: Line protocol on Interface FastEthernet0/1, changed state to down

*Mar 17 01:08:12.587: %LINEPROTO-5-UPDOWN: Line protocol on Interface FastEthernet0/2, changed state to down

*Mar 17 01:08:19.373: %LINEPROTO-5-UPDOWN: Line protocol on Interface FastEthernet0/2, changed state to up

*Mar 17 01:08:19.399: %LINEPROTO-5-UPDOWN: Line protocol on Interface FastEthernet0/1, changed state to up

*Mar 17 01:08:20.355: %LINK-3-UPDOWN: Interface Port-channel1, changed state to up

*Mar 17 01:08:21.362: %LINEPROTO-5-UPDOWN: Line protocol on Interface Port-channel1, changed state to up

SW01(config-if-range)#

SW01(config-if-range)#interface port-channel1

SW01(config-if)# switchport trunk encapsulation dot1q

SW01(config-if)# switchport mode trunk

SW01(config-if)#

SW01(config-if)#interface Fa0/12

SW01(config-if)# description ### TEST PC: 172.27.100.2 ###

SW01(config-if)# switchport mode access

SW01(config-if)# switchport access vlan 300

SW01(config-if)#end

W01#write memory

Building configuration...

[OK]


SW01#show interface description

Interface                      Status         Protocol Description

Vl1                            up             down    

Fa0/1                          up             up       ### PortChannel1 ###

Fa0/2                          up             up       ### PortChannel1 ###

Fa0/3                          down           down    

Fa0/4                          down           down    

Fa0/5                          down           down    

Fa0/6                          down           down    

Fa0/7                          down           down    

Fa0/8                          down           down    

Fa0/9                          down           down    

Fa0/10                         down           down    

Fa0/11                         down           down    

Fa0/12                          up             up       ### TEST PC: 172.27.100.2 ###

Fa0/13                         down           down    

Fa0/14                         down           down    

Fa0/15                         down           down    

Fa0/16                         down           down    

Fa0/17                         down           down    

Fa0/18                         down           down    

Fa0/19                         down           down    

Fa0/20                         down           down    

Fa0/21                         down           down    

Fa0/22                         down           down    

Fa0/23                         down           down    

Fa0/24                         down           down    

Gi0/1                          down           down    

Gi0/2                          down           down    

Po1                            up             up


SW01#show etherchannel summary    // NOTICE THE LACP PROTOCOL WAS USED

Flags:  D - down        P - bundled in port-channel

        I - stand-alone s - suspended

        H - Hot-standby (LACP only)

        R - Layer3      S - Layer2

        U - in use      f - failed to allocate aggregator


        M - not in use, minimum links not met

        u - unsuitable for bundling

        w - waiting to be aggregated

        d - default port


Number of channel-groups in use: 1

Number of aggregators:           1


Group  Port-channel  Protocol    Ports

------+-------------+-----------+-----------------------------------------------

1      Po1(SU)         LACP      Fa0/1(P)    Fa0/2(P)  


I've assigned the PC with an IP address 172.27.100.2/29 and can ping the FortiGate remote/gateway IP address.


C:\Users\john>ipconfig


Windows IP Configuration


Ethernet adapter Ethernet:


   Connection-specific DNS Suffix  . :

   Link-local IPv6 Address . . . . . : fe80::b6e2:2fc0:a2d7:10ab%cd

   IPv4 Address. . . . . . . . . . . : 172.27.100.2

   Subnet Mask . . . . . . . . . . . : 255.255.255.248

   Default Gateway . . . . . . . . . : 172.27.100.1


C:\Users\john>ping 172.27.100.1


Pinging 172.27.100.1 with 32 bytes of data:

Reply from 172.27.100.1: bytes=32 time=1ms TTL=255

Reply from 172.27.100.1: bytes=32 time=1ms TTL=255

Reply from 172.27.100.1: bytes=32 time=1ms TTL=255

Reply from 172.27.100.1: bytes=32 time=1ms TTL=255


Ping statistics for 172.27.100.1:

    Packets: Sent = 4, Received = 4, Lost = 0 (0% loss),

Approximate round trip times in milli-seconds:

    Minimum = 1ms, Maximum = 1ms, Average = 1ms


I can ping the FortiGate Layer 3 sub-interface (VLAN 300) and lan2 and lan3 ports showed as green/up.


I tried to simulate an interface failure by disconnecting the RJ45 cable in lan2 port.


There was a single ping packet loss/drop that was observed.


C:\Users\john>ping 172.27.100.1 -t


Pinging 172.27.100.1 with 32 bytes of data:

Reply from 172.27.100.1: bytes=32 time=1ms TTL=255

Reply from 172.27.100.1: bytes=32 time=9ms TTL=255

Reply from 172.27.100.1: bytes=32 time=1ms TTL=255

Reply from 172.27.100.1: bytes=32 time=15ms TTL=255

Request timed out.

Reply from 172.27.100.1: bytes=32 time=1ms TTL=255

Reply from 172.27.100.1: bytes=32 time=1ms TTL=255

Reply from 172.27.100.1: bytes=32 time=1ms TTL=255

Reply from 172.27.100.1: bytes=32 time=1ms TTL=255

Reply from 172.27.100.1: bytes=32 time=1ms TTL=255

Reply from 172.27.100.1: bytes=32 time=1ms TTL=255


Ping statistics for 172.27.100.1:

    Packets: Sent = 11, Received = 10, Lost = 1 (9% loss),

Approximate round trip times in milli-seconds:

    Minimum = 1ms, Maximum = 15ms, Average = 3ms

Control-C

^C


Saturday, November 4, 2023

Perform Packet Capture in FortiGate Firewall

Here's a link in using the packet capture tool or sniffer in a FortiGate firewall.

To perform packet capture in FortiGate, select a VDOM: internet > Network > Diagnostics > select Interface: Internet (wan) > Packet Capture.


You can optionally enable/toggle Filters to narrow down Host, Port and Protocol  number.


I've used the switch SVI to perform ping test from the "inside" LAN.


SW01#show ip interface brief

Interface              IP-Address      OK? Method Status                Protocol

Vlan1                  unassigned      YES NVRAM  up                    up     

Vlan300                172.x.x.5    YES manual up                    up     

FastEthernet0/1        unassigned      YES unset  up                    up     

<OUTPUT TRUNCATED>

SW01#ping 8.8.8.8 source 172.x.x.5


Type escape sequence to abort.

Sending 5, 100-byte ICMP Echos to 8.8.8.8, timeout is 2 seconds:

Packet sent with a source address of 172.x.x.5

!!!!!

Success rate is 100 percent (5/5), round-trip min/avg/max = 1/5/9 ms


Enable/toggle Filters > select Filtering syntax: Basic (default) > type Host: 172.x.x.5 > click Start Capture.


You can observe the Packet Capture in FortiGate web GUI or click Save as pcap for offline analysis.


The .pcap file will be saved under Downloads folder (in Windows).

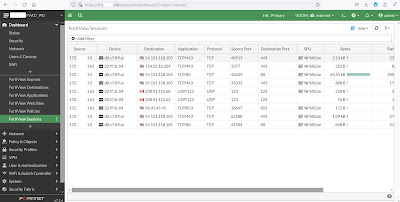
To view the current FortiGate IP sessions (5-tuple), go to Dashboard > FortiView Sessions.

To view in CLI, you can use the get system session list command. Use grep to filter the command output.


FG-FW01_PRI # config vdom


FG-FW01_PRI (vdom) # edit internet

current vf=internet:4

FG-FW01_PRI (internet) # get system session list | grep 172.x.x.5

tcp     3576   172.x.x.5:49269 202.x.x.30:49269 54.151.118.105:443 -      

tcp     3599   172.x.x..5:43013 202.x.x.30:43013 104.82.75.211:80 -        

icmp    29     172.x.x.5:10  202.x.x.30:60426 8.8.8.8:8        -          

tcp     3564   172.x.x.5:29031 202.x.x.30:29031 54.151.118.105:443


Here's a link in using the debug flow tool in a FortiGate firewall.

There's no equivalent packet-tracer command in FortiGate which generates a virtual packet to verify routing, ACL and NAT similar to Cisco ASA firewall. To find the matching Firewall Policy rule, use Debug Flow or diagnose debug flow CLI command:


Go to VDOM: internet > Network > Diagnostics > Debug flow tab.


Type the number of packets (count): 100 (default) > enable/toggle Filters > select Filter type: Basic (default) > select IP type: IPv4 (default) > type IP address: 8.8.8.8 > select Protocol: ICMP.

Click Start debug flow.

Generate packets to capture. Click Stop debug flow when finished.


SW01#ping 8.8.8.8 source 172.x.x.5 repeat 100


Type escape sequence to abort.

Sending 100, 100-byte ICMP Echos to 8.8.8.8, timeout is 2 seconds:

Packet sent with a source address of 172.x.x.5

!!!!!!!!!!!!!!!!!!!!!!!!!!!!!!!!!!!!!!!!!!!!!!!!!!!!!!!!!!!!!!!!!!!!!!

!!!!!!!!!!!!!!!!!!!!!!!!!!!!!!

Success rate is 100 percent (100/100), round-trip min/avg/max = 1/4/9 ms


You can view offline or save as CSV file.

Notice policy-2 is matched and SNAT (Source NAT) is used.


Below are the diagnose debug CLI commands:


diagnose debug reset   // CLEAR ALL DIAGNOSE SETTINGS


diagnose debug flow filter addr <SOURCE OR DESTINATION IP>   // BY DEFAULT THERE'S NO FILTER, DEFINE OR NARROW DOWN SPECIFIC IP


diagnose flow trace start <PACKET COUNT>


diagnose debug enable   // TURN ON DEBUG


diagnose debug disable   // TURN OFF DEBUG, SIMILAR TO CISCO'S undebug all


FG-FW01_PRI # config vdom   // GO TO A VDOM


FW01_PRI (vdom) # edit internet

current vf=internet:4


FW01_PRI (internet) # diagnose debug reset


FW01_PRI (internet) # diagnose debug flow

filter     Trace packet with filter.

filter6    Trace packet with IPv6 filter.

trace      Start/stop trace.

show       Enable/disable display of trace on console.


FW01_PRI (internet) # diagnose debug flow filter

clear      Clear filter.

vd         Index of virtual domain.

vd-name    Name of virtual domain.

proto      Protocol number.

addr       IP address.

saddr      Source IP address.

daddr      Destination IP address.

port       port

sport      Source port.

dport      Destination port.

negate     Inverse filter.


FW01_PRI (internet) # diagnose debug flow filter addr

<xxx.xxx.xxx.xxx>    Host IP (ip1/from).


FW01_PRI (internet) # diagnose debug flow filter addr 8.8.8.8


FW01_PRI (internet) # diagnose debug flow trace

start     Start trace.

stop      Stop trace.

start6    Start IPv6 trace.

stop6     Stop IPv6 trace.


FW01_PRI (internet) # diagnose debug flow trace start

<xxx>    Repeat number.


FW01_PRI (internet) # diagnose debug flow trace start 100


FW01_PRI (internet) # diagnose debug enable


FW01_PRI (internet) # id=65308 trace_id=5 func=print_pkt_detail line=5868 msg="vd-internet:0 received a packet(proto=1, 172.x.x.5:13->8.8.8.8:2048) tun_id=0.0.0.0 from LAG1-INSIDE. type=8, code=0, id=13, seq=0."

id=65308 trace_id=5 func=init_ip_session_common line=6049 msg="allocate a new session-0026c30d, tun_id=0.0.0.0"

id=65308 trace_id=5 func=vf_ip_route_input_common line=2605 msg="find a route: flag=04000000 gw-202.x.x.1 via wan"

id=65308 trace_id=5 func=__iprope_tree_check line=524 msg="gnum-100004, use int hash, slot=53, len=3"

id=65308 trace_id=5 func=get_new_addr line=1228 msg="find SNAT: IP-202.x.x.30(from IPPOOL), port-60429"

id=65308 trace_id=5 func=fw_forward_handler line=922 msg="Allowed by Policy-2: SNAT"

id=65308 trace_id=5 func=ids_receive line=428 msg="send to ips"

id=65308 trace_id=5 func=__ip_session_run_tuple line=3485 msg="SNAT 172.x.x.5->202.x.x.30:60429"

id=65308 trace_id=6 func=print_pkt_detail line=5868 msg="vd-internet:0 received a packet(proto=1, 8.8.8.8:60429->202.x.x.30:0) tun_id=0.0.0.0 from wan. type=0, code=0, id=60429, seq=0."

id=65308 trace_id=6 func=resolve_ip_tuple_fast line=5956 msg="Find an existing session, id-0026c30d, reply direction"

id=65308 trace_id=6 func=__ip_session_run_tuple line=3498 msg="DNAT 202.x.x.30:0->172.x.x.5:13"

id=65308 trace_id=6 func=vf_ip_route_input_common line=2605 msg="find a route: flag=00000000 gw-172.x.x.5 via LAG1-INSIDE"

id=65308 trace_id=6 func=npu_handle_session44 line=1199 msg="Trying to offloading session from wan to LAG1-INSIDE, skb.npu_flag=00000000 ses.state=00010204 ses.npu_state=0x04001008"

id=65308 trace_id=6 func=fw_forward_dirty_handler line=414 msg="state=00010204, state2=00000001, npu_state=04001008"

id=65308 trace_id=7 func=print_pkt_detail line=5868 msg="vd-internet:0 received a packet(proto=1, 172.x.x.5:13->8.8.8.8:2048) tun_id=0.0.0.0 from LAG1-INSIDE. type=8, code=0, id=13, seq=1."

id=65308 trace_id=7 func=resolve_ip_tuple_fast line=5956 msg="Find an existing session, id-0026c30d, original direction"

id=65308 trace_id=7 func=npu_handle_session44 line=1199 msg="Trying to offloading session from LAG1-INSIDE to wan, skb.npu_flag=00000400 ses.state=00010204 ses.npu_state=0x04001008"

id=65308 trace_id=7 func=ip_session_install_npu_session line=358 msg="npu session installation succeeded"

id=65308 trace_id=7 func=fw_forward_dirty_handler line=414 msg="state=00010204, state2=00000001, npu_state=04001408"

id=65308 trace_id=7 func=__ip_session_run_tuple line=3485 msg="SNAT 172.x.x.5->202.x.x.30:60429"

id=65308 trace_id=8 func=print_pkt_detail line=5868 msg="vd-internet:0 received a packet(proto=1, 8.8.8.8:60429->202.x.x.30:0) tun_id=0.0.0.0 from wan. type=0, code=0, id=60429, seq=1."

id=65308 trace_id=8 func=resolve_ip_tuple_fast line=5956 msg="Find an existing session, id-0026c30d, reply direction"

id=65308 trace_id=8 func=__ip_session_run_tuple line=3498 msg="DNAT 202.x.x.30:0->172.x.x.5:13"

id=65308 trace_id=8 func=npu_handle_session44 line=1199 msg="Trying to offloading session from wan to LAG1-INSIDE, skb.npu_flag=00000400 ses.state=00010204 ses.npu_state=0x04001408"

id=65308 trace_id=8 func=ip_session_install_npu_session line=358 msg="npu session installation succeeded"

id=65308 trace_id=8 func=fw_forward_dirty_handler line=414 msg="state=00010204, state2=00000001, npu_state=04001c08"


FW01_PRI (internet) # diagnose debug disable


You can use the Policy lookup tool (with magnifying glass icon) under Firewall Policy.


Select Incoming Interface: LAG1-INSIDE > select IP Version (IPv4 by default) > select Protocol: TCP (default) > type Source: 172.x.x.5 > type Destination: 8.8.8.8 > type Destination Port: 8 (ICMP request) > click Search.

The matching Firewall Policy will be selected/highlighted in red.


Sunday, October 1, 2023

Upgrade FortiGate HA Cluster Firmware

Here's a Fortinet link in performing a FortiGate High Availability (HA) cluster firmware upgrade. The process is very similar to a standalone FortiGate upgrade. You only upload or transfer the firmware to the Primary FortiGate device.

You can upgrade firmware on all nodes in a cluster from the primary node.

The following process occurs when you perform the HA upgrade procedure:


  1. The primary node pushes the firmware image to the member nodes.
  2. The primary node notifies the member nodes of the upgrade, and it takes their user traffic during the upgrade.
  3. The upgrade command is run on the member nodes, the systems are rebooted, and the member nodes send the primary node an acknowledgment that upgrade has been completed.
  4. The upgrade command is run on the primary node, and it reboots. When the system is rebooting, a member node assumes primary status, and the traffic fails over from the former primary node to the new primary node.


After the upgrade process is completed, the system determines whether the original node becomes the primary node, according to the HA Override setting:


  • If Override is enabled, the cluster considers the Device Priority setting. Both nodes usually make a second failover in order to resume their original roles.
  • If Override is disabled, the cluster considers uptime first. The original primary node will have a smaller uptime due to the order of reboots during the firmware upgrade. Therefore it will not resume its active role; instead, the node with the greatest uptime will remain the new primary node. A second failover will not occur.


Reboot times vary by the appliance model, and also by differences between the original firmware version and the firmware version you are installing.


There's also a debate in the Fortinet support forum and some in Reddit whether you can directly upgrade a new FortiGate to the target FortiOS. Some Fortinet folks strictly encourage to follow the upgrade path even in a new device in order to avoid corruption and other unforeseen issues, i.e. "brick" the device.


Here's the result taken from ChatGPT which is slightly different from the Fortinet doc, i.e. upload firmware on both Primary and Secondary ForitGate units.


Upgrading the firmware on a FortiGate High Availability (HA) cluster involves several steps to ensure a smooth and seamless transition. Here's a general guide on how to upgrade the firmware on a FortiGate HA cluster:

Important Note: Before proceeding with the firmware upgrade, make sure to read the release notes for the new firmware version to understand any potential compatibility issues or new features.

    Backup Configuration:
        Log in to the primary FortiGate unit and backup the current configuration. Go to System > Dashboard > Status > Backup and create a backup of the configuration.

    Download Firmware:
        Download the firmware image for the desired version from the Fortinet Support Portal (https://support.fortinet.com/).

    Upload Firmware to Both Units:
        Log in to both the primary and secondary FortiGate units.
        Navigate to System > Firmware and upload the firmware image to both units.


    Verify Compatibility:
        Confirm that the firmware version you're upgrading to is compatible with your hardware and any other devices in your network, including switches, routers, and third-party devices.

    Upgrade the Secondary Unit:
        Initiate the firmware upgrade on the secondary unit first. This helps ensure that you always have one active unit during the upgrade process.
            Go to System > Dashboard > Status > System Information and click on the "Update" link next to the secondary unit's firmware version.
            Follow the on-screen instructions to upload and install the new firmware on the secondary unit.

    Failover to the Secondary Unit:
        After upgrading the secondary unit, perform a failover to make it the active unit. This can be done manually or automatically depending on your HA configuration.
            To manually failover, go to System > Dashboard > Status > HA and click on the "Failover" button.
            To configure automatic failover, go to System > HA > Advanced > Configurations and set the appropriate options.

    Test the Secondary Unit:
        Verify that the secondary unit is functioning correctly as the active unit. Check for any issues or configuration discrepancies.

    Upgrade the Primary Unit:
        Once the secondary unit is confirmed to be working as expected, initiate the firmware upgrade on the primary unit.
            Go to System > Dashboard > Status > System Information and click on the "Update" link next to the primary unit's firmware version.
            Follow the on-screen instructions to upload and install the new firmware on the primary unit.

    Failover Back to the Primary Unit:
        After upgrading the primary unit, perform a failover back to the primary unit if it's not set to automatically fail back.

    Test and Monitor:
        After the upgrade is complete and both units are operating normally, thoroughly test your network to ensure that all services and configurations are functioning as expected.

    Clean Up:
        Once you're confident that the upgrade was successful, you can delete any backup configuration files and older firmware versions to free up storage space.

Always refer to the official Fortinet documentation and release notes for your specific FortiGate model and firmware version for detailed and up-to-date instructions. Additionally, consider performing these upgrades during a maintenance window to minimize disruption to your network services.


You can check the current firmware in FortiGate GUI by going to Global VDOM: Status > System Infromation > Firmware: v7.2.4 build1396.

This is the Primary FortiGate current firmware.

This is the Secondary FortiGate current firmware.

You can also use the get system status command to verify the current firmware Version.


FW01_PRI # get system status

Version: FortiGate-40F v7.2.4,build1396,230131 (GA.F)

Firmware Signature: certified

Virus-DB: 1.00000(2018-04-09 18:07)

Extended DB: 1.00000(2018-04-09 18:07)

AV AI/ML Model: 0.00000(2001-01-01 00:00)

IPS-DB: 6.00741(2015-12-01 02:30)

IPS-ETDB: 0.00000(2001-01-01 00:00)

APP-DB: 6.00741(2015-12-01 02:30)

INDUSTRIAL-DB: 6.00741(2015-12-01 02:30)

IPS Malicious URL Database: 1.00001(2015-01-01 01:01)

IoT-Detect: 0.00000(2022-08-17 17:31)

Serial-Number: FGT40FTKxxxxP0S

BIOS version: 05000021

System Part-Number: P24680-04

Log hard disk: Not available

Hostname: FW01_PRI

Private Encryption: Disable

Operation Mode: NAT

Current virtual domain: internet

Max number of virtual domains: 10

Virtual domains status: 2 in NAT mode, 0 in TP mode

Virtual domain configuration: multiple

FIPS-CC mode: disable

Current HA mode: a-p, primary

Cluster uptime: 114 days, 21 hours, 45 minutes, 42 seconds

Cluster state change time: 2023-03-22 13:32:22

Branch point: 1396

Release Version Information: GA

System time: Tue Jul 11 16:37:30 2023

Last reboot reason: warm reboot


Check the FortiOS upgrade path and release notes in the Fortinet support link.


Select Product: FortiGate > click Upgrade Path > select Current Product: FortiGate-40F > select Current FortiOS Version: 7.2.4 > select Upgrade To FortiOS Version: 7.2.5 > click GO.


The Recommended Upgrade Path is displayed.


Go to Download tab > click v7.00 folder/directory.

Locate the firmware folder sub-directory and find the file for the FortiGate product/platform.


Click Checksum to view the MD5 and SHA-512 Checksum code. Click HTTPS (hyperlink) to download the firmware file.

Before performing the firmware upgrade, check if the High Availability (HA) pair are synchronized under Global VDOM > System > HA.

The upgrade is only performed in the Primary FortiGate. The Primary will send a copy of the firmware to the Secondary (Passive) FortiGate, the Secondary will be the first to be upgraded and then it will auto reboot to reflect the new firmware version.


The Primary will be the next to be upgraded and then automatically reboot.


To perform the HA Active-Passive firmware upgrade, select VDOM: Global > System > Fabric Management > select the Device > Upgrade.


Go to File Upload > click Browse > locate the firmware file.

Click Confirm and Backup Config.

Click Continue.


The Secondary FortiGate (left ping window) went offline due to the upgrade process.


Primary FortiGate (right ping window) will remain online/active.


The Secondary FortiGate became HA: Primary and Firmware was updated: v7.2.5 build 1517.

The Primary FortiGate automatically went offline due to the upgrade while Secondary FortiGate remained online (Primary/Active).

The Primary FortiGate went back online again.

The Primary FortiGate became the Primary/Active again and firmware was updated: 7.2.5 build 1517.

The HA Active-Passive firmware upgrade procedure finished around 10 minutes.


HA re-synchronized and the Primary FortiGate became Primary again since it has a higher Priority: 200.