Here's a nice link for the Cisco Firepower Device Manager (FDM) Youtube video training.
You can login to FDM via HTTPS on a web browser. The FDM is purely managed via web/HTTPS and doesn't require Java installed unlike with the old ASDM.
The default
HTTPS IP address is 192.168.45.45 and default login: admin / Admin123
You'll automatically walkthrough the FTD initial setup wizard.
The first
step (you can optionally skip this) is to connect the FTD G0/0 (Outside)
interface to your ISP modem/router > configure G0/0 Outside (WAN) Interface,
under Configure IPv4 > select Using DHCP (auto obtain an IP address).
By
default, the FTD setup wizard assumes G0/0 is connected to the Outside/ISP and G0/1 connects to the Inside LAN. In this
case, my FTD G0/0 is connected to the ISP ONT fiber device. You can select Manually
input to configure a static IP address.
I left
the default OpenDNS for the Primary and Secondary DNS IP Address under the
Management Interface.
You can
edit the FTD hostname under Firewall Hostname. Click Next.
The changes took several minutes as FTD was testing the ISP/WAN connectivity and tried to connect to Cisco (www.cisco.com).
The FTD test to ISP/WAN/Gateway took around 2-3 minutes to complete. I encountered an error: Connection testing failed since I had my laptop directly connected to FTD's MGMT port.
Just ignore this error for now and continue with the FTD's initial setup.
Select
the Time Zone (in my case UTC+8 Asia/Singapore). Click on the icon with the
letter i to get more information.
I left
the Default NTP Time Server under NTP Time Server. Click Next.
You'll need to register the FTD with Cisco Smart Licensing Server. You can skip this for now and just scroll down.
Select the Start 90-day evaluation period without registration to enable the free 90-day eval license: URL Filtering, Malware, Threat (IPS, Security Intelligence). Click Finish.
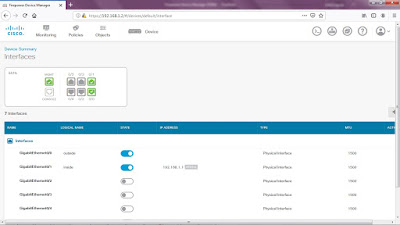
Click on option 1: Configure Interfaces. This will bring you to the Device Summary page for Interfaces.
Notice the three FTD ports are green or active: MGMT, G0/0 (outside) and G0/1 (inside).
I
troubleshoot the FTD WAN/ISP connectivity via CLI and detected the Outside G0/0 is up/up
(Layer 1 and 2) and received an IP address via DHCP from the ISP fiber ONT
device.
It also
received a default route and FTD can ping the Internet (Google DNS 8.8.8.8)
> show
interface GigabitEthernet 0/0
Interface
GigabitEthernet0/0 "outside", is up, line protocol is up
Hardware is i82574L rev00, BW 1000 Mbps, DLY
10 usec
Auto-Duplex(Full-duplex),
Auto-Speed(1000 Mbps)
Input flow control is unsupported,
output flow control is off
MAC address b0fa.eb97.72cc, MTU 1500
IP
address 222.164.10.189, subnet mask 255.255.254.0
415741 packets input, 27314861 bytes, 0
no buffer
Received 396234 broadcasts, 0 runts, 0
giants
5 input errors, 5 CRC, 0 frame, 0
overrun, 0 ignored, 0 abort
0 pause input, 0 resume input
0 L2 decode drops
302 packets output, 121222 bytes, 0
underruns
0 pause output, 0 resume output
0 output errors, 0 collisions, 22
interface resets
0 late collisions, 0 deferred
0 input reset drops, 0 output reset
drops
input queue (blocks free curr/low):
hardware (485/456)
output queue (blocks free curr/low):
hardware (511/508)
Traffic Statistics for "outside":
413760 packets input, 19690501 bytes
197 packets output, 53516 bytes
17863 packets dropped
1 minute input rate 361 pkts/sec, 17102 bytes/sec
1 minute output rate 0 pkts/sec, 1 bytes/sec
1 minute drop rate, 13 pkts/sec
5 minute input rate 379 pkts/sec, 17956 bytes/sec
5 minute output rate 0 pkts/sec, 0 bytes/sec
5 minute drop rate, 14 pkts/sec
> show
route
Codes: L
- local, C - connected, S - static, R - RIP, M - mobile, B - BGP
D - EIGRP, EX - EIGRP external, O -
OSPF, IA - OSPF inter area
N1 - OSPF NSSA external type 1, N2 -
OSPF NSSA external type 2
E1 - OSPF external type 1, E2 - OSPF
external type 2, V - VPN
i - IS-IS, su - IS-IS summary, L1 -
IS-IS level-1, L2 - IS-IS level-2
ia - IS-IS inter area, * - candidate
default, U - per-user static route
o - ODR, P - periodic downloaded static
route, + - replicated route
Gateway
of last resort is 222.164.10.1 to network 0.0.0.0
S*
0.0.0.0 0.0.0.0 [1/0] via 222.164.10.1, outside
C 192.168.1.0 255.255.255.0 is directly
connected, inside
L 192.168.1.1 255.255.255.255 is directly
connected, inside
C 222.164.10.0 255.255.254.0 is directly
connected, outside
L 222.164.10.189 255.255.255.255 is
directly connected, outside
> ping
8.8.8.8
Type
escape sequence to abort.
Sending
5, 100-byte ICMP Echos to 8.8.8.8, timeout is 2 seconds:
!!!!!
Success
rate is 100 percent (5/5), round-trip min/avg/max = 1/2/10 ms
You can also launch a CLI prompt and issue CLI commands by clicking the CLI Console icon.
I'm unable to perform FTD Updates since the MGMT interface requires an Internet connectivity to get its update from the Cisco Cloud.
I connected the devices according to my lab topology. The FTD MGMT and G0/1 (inside) interfaces are both in a common Layer 2 VLAN. I used a flat network on VLAN 1 on the switch for simplicity.
Notice the ISP/WAN/Gateway, Internet, DNS Server and NTP server turned green afterwards.
To
perform FTD Updates: Geolocation, Rule (IPS), Vulnerability Database (VDB) and Security
Intelligence (SI) Feed, click Device > Updates > View Configuration.
Click on
the i and it informs you that Update may be large and can take up
to 45 minutes. Click Update Now on each FTD Update.
Under Rule Update > click Update Now > click Yes to continue.
Under VDB Update > click Update Now > click Yes to continue.
Click See Task List to view the individual Update download/install status.
Click Configure to change the Frequency and Time under each Update.
To enable the Smart License features (Threat, Malware, URL), click Device >
Smart License > View Configuration.
Notice only the Base License (included by default), which is used for Base Firewall Capabilities (switching/routing, ACL and NAT) and Application Visibility and Control (AVC), is automatically Enabled.
Aside from activating the 90-day Evaluation license, you'll also need to Enable each feature for Threat, Malware and URL. Click Enable under each feature.
To perform FTD Configuration backup and recovery, click Device > Backup and Restore > View Configuration.
You can configure the frequency on either Recurring (multiple) or Scheduled (one-time) Backup.
I'll just perform a Manual Backup (immediate) in this case by clicking Backup Now > type a
Name for the Backup file (FTD-Config-31July2019) > optionally type a Description > click Backup
Now.
The
FTD Manual Backup took several minutes to complete (around 4 minutes).
Notice the Backup file will appear which you can download by hovering under Actions > click Download.
Click OK and the Backup file will be saved to your Downloads folder.
There's a couple of ways to roll back or restore to a previous configuration in FTD. The first option is under Upload > click Browse > choose a Backup file.
Click Upload to Continue.
The other way to restore the FTD configuration is to select a specific backup file > hover under Actions > click Restore (green icon).
Click Do not delete the backup after restoring if you want to keep the backup file. Click Restore. There's a warning: A restore will trigger a reset of the device. The FTD will automatically reboot after the backup restore.
To change the Management Access on FTD, click Device > System Settings > Management
Access.
Under
Management Interface, notice both the HTTPS and SSH management protocols are enabled by default for any IPv4 and IPv6 networks.
You can
configure specific interface or security zones to allow management traffic on the FTD under Data Interfaces > hover
under Actions to edit the inside interface.
Click the plus (+) icon to configure an interface for management access to the FTD.
You can configure Syslog under System Settings > Logging Settings (on the left). You can change the Logging Severity and configure an external Syslog server.
Click
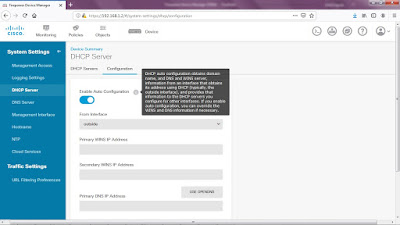
DHCP Server under System Settings.
In this
case, I'll remove the default DHCP server for the inside interface since everything in my lab is using a static IP address.
Hover
under Actions > Delete (trash icon) > OK to delete the DHCP server.
Notice an orange or amber dot on the Deployment icon if there's a pending change on the FTD.
You can
make all your changes in one go and deploy once. Click the
Deployment > Deploy Now.
Notice the orange/amber dot has disappeared after the Deployment push.
To create again a DHCP Server on a specific interface, click Create DHCP Server.
Toggle Enabled DHCP server > select an interface >type an Address Pool.
You can change the outside interface's DHCP configuration (from the ISP)
under Configuration.
This is
similar to the ASA ip address dhcp setroute command.
Click Monitoring to view the FTD System Dashboard statistics and various graphs.
Click Events to view Connection Logs. Hover a specific Connection Log > click View Details to see more info.
Click
Policies to view NAT and Access Control policies.
Notice
there's a default Dynamic NAT (PAT) policy under Manual NAT Rules configured for Any
IPv4 Source Address and Any Source Port which is translated on the FTD outside interface
going to Any Destination Address and Any Destination Port.
There's also a default Access Control rule #1 which has an Action: Trust for Any Networks and Any Ports sourced from the inside zone going to Any Destination Networks and Any Ports and Any Protocol on the outside zone.
Notice there's an implicit Default Action: Block at the bottom of the Access Control Rules.
Click Objects to view various Object Types: Networks, Ports, Security Zones, etc.
For troubleshooting and escalating to Cisco TAC, they might require you to send a troubleshooting file which is found under Troubleshoot > click Request File To Be Created.
There's a note: It can take up to 1 hour to generate the troubleshooting file depending on the device load.
Click See Task List to monitor the status.
A tar.gz compressed file will be generated.
You can download the Troubleshooting file by clicking the download icon (arrow pointing down).


