The Cisco Firepower Management Center (FMC) provides robust reporting capabilities that can help administrators and analysts investigate intrusion, indicators of compromise (IOC) and suspicious activities identified by Next-Generation Intrusion Prevention System (NGIPS).


You can plot and view Intrusion Event graphs by going to Overview > Summary > Intrusion Event Performance > Select Device (sensor) > select Graph type > Select a Time Range.


You can also view Reports from Analysis > Intrusion > Events > Report Designer (the second row of menu tabs)


To create a new FMC Report, click Create Report Template. Fill in the necessary information on the fields then type Generate.


You can either download or click the file to view the report in the web browser.


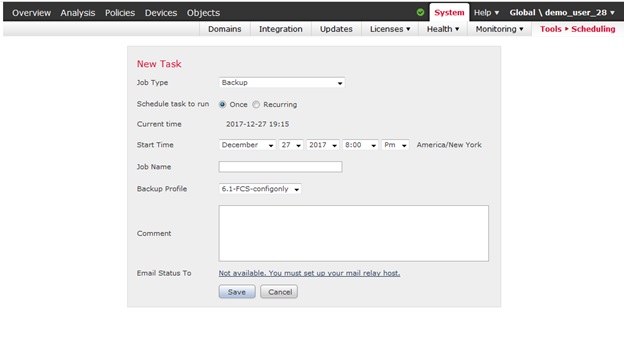
You can also schedule Reports under System > Tools > Scheduling

Click Add Task > Job Type > Report


To create a new incident, click Create Incident.


Alerts
The FMC allows you to configure email alerts, syslog and SNMP traps. Go to Policies > Access Control > Intrusion > edit a specific IPS Policy (pencil icon).

Go to Advanced Settings.

Click Enabled under External Responses > SNMP Alerting or Syslog Alerting.

Click Edit (pencil icon) to configure specific SNMP and Syslog Alerting settings.


To configure Global Email and Syslog Alert settings, go to Policies > Actions > Alerts.

Click Edit (pencil icon) to configure specific Email and Syslog Alerting settings.


Click on the arrow beside the Count to view specific NGIPS sensor health.


Intrusion Events
You can view Intrusion Events by going to Overview > Summary > Intrusion Event Statistics.


Intrusion Event Performance
You can plot and view Intrusion Event graphs by going to Overview > Summary > Intrusion Event Performance > Select Device (sensor) > select Graph type > Select a Time Range.

For more details of an event go to Analysis > Intrusions > Events.


You can view and generate FMC Reports by going to Overview > Reporting.

You can also view Reports from Analysis > Intrusion > Events > Report Designer (the second row of menu tabs)


To create a new FMC Report, click Create Report Template. Fill in the necessary information on the fields then type Generate.


You can either download or click the file to view the report in the web browser.


You can also schedule Reports under System > Tools > Scheduling

Click Add Task > Job Type > Report


Incident
An Incident is a violation of a security policy. You can view and create FMC Incidents by going to Analysis > Intrusion > Incidents.

To create a new incident, click Create Incident.


You can create a report by clicking Generate Report > Generate.


Alerts
The FMC allows you to configure email alerts, syslog and SNMP traps. Go to Policies > Access Control > Intrusion > edit a specific IPS Policy (pencil icon).

Go to Advanced Settings.

Click Enabled under External Responses > SNMP Alerting or Syslog Alerting.

Click Edit (pencil icon) to configure specific SNMP and Syslog Alerting settings.


To configure Global Email and Syslog Alert settings, go to Policies > Actions > Alerts.

Click Edit (pencil icon) to configure specific Email and Syslog Alerting settings.


You can also modify FMC alert based on event impact under Policies > Actions Alert > Impact Flag Alerts.

FMC Troubleshooting
There are tools available to troubleshoot issues on the FMC system. To audit user logins, go to System > Monitoring > Audit.


To view the health of NGIPS sensor and FMC, go to System > Health > Monitor.

Click on the arrow beside the Count to view specific NGIPS sensor health.

Go to System > Health > Policy to create and modify various Health policies.


Go to System > Health > Events in order to view FMC Health Events.

Go to System > Health > Alerts to configure various Health Alerts.

Go System > Monitoring > Syslog to view syslogs referring to the FMC appliance. You can search and filter using grep-like regular expressions (regex).


No comments:
Post a Comment